
In HubSpot, everything works across properties and data fields – the CRM helps you understand how the data goes in, whilst the reporting tools allow you to analyse and understand that data.
Hub: Marketing
Difficulty: Easy
Tier: Free/Starter+
Sam Banks, our Technical Digital Strategist at Fuelius, explains how exactly HubSpot reporting works in the CRM. We'll cover dashboards, filters, permissions, reports and more. Watch his video here or follow the handy guide below...
- Introduction to HubSpot Reporting
- Using HubSpot Dashboards
- Filtering & Sharing Dashboards
- Using HubSpot Reports
- Using HubSpot's Report Library
Introduction to HubSpot Reporting
If you’re familiar with HubSpot, you’ll already be aware that everything works on properties and data fields, and by using a CRM, you can understand and analyse the information within it. This is where HubSpot reporting comes in.
Using HubSpot Dashboards
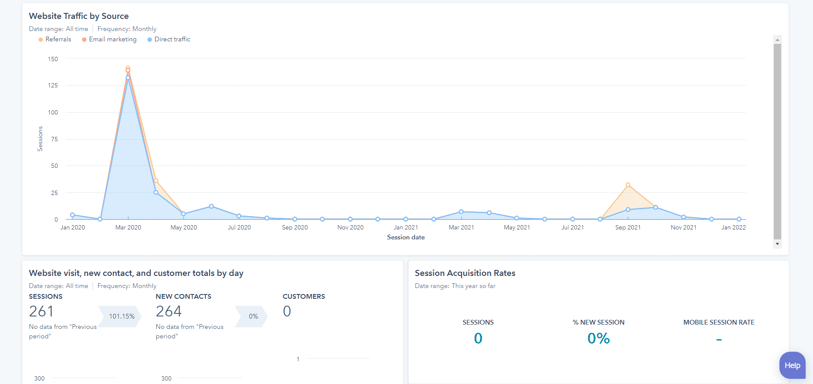
In the Reports tab of HubSpot, you’ll find an analytics tool which is largely based on your HubSpot tracking code. If you’ve not set up any reporting yet, your dashboard will be fairly blank, but you can set up individual widgets for specific reporting that you can then see a brief overview here. These reports are completely customisable and can be reordered and resized seamlessly at your convenience.
As such, they’re not limited to just a sales or marketing view, they can be set to record any kind of KPI that is relevant to you. Be its web traffic, sessions, or conversion performance, you can also drill down into sales performance too!
HubSpot offers attribution-level reporting on top of all this, for example, you can take a look at what the role was of integration within the overall contact conversion journey compared to the actual inter-interaction source attribution, which is based on the source and the different touchpoints they’ve had across the portal.
If you’re a B2B business, you may find account-based marketing reports quite useful. Here you can have reports based on the sessions by target accounts or pageviews by target accounts and even contacts by persona groups as well. These reporting widgets are also very interactive. You can switch between data points in real-time, and as the data points are based on fields, you can also for example click on a certain month's sessions and find the entrance URL that they came from.
Filtering & Sharing Dashboards
HubSpot's reporting dashboard can be filtered to view certain times and dates giving you a closer look at what's happening and at what time. You can add a filter on dates, owners' teams, the pipeline, or even deals. To do this, simply go to your dashboard and click the ‘Filter Dashboard’ button on the left-hand side of the screen above your dashboard.
You can also assign a dashboard so you can restrict or divide and give access to only those who need it. So you could either give everyone in the portal permission or you can actually split the URL by team so only specific teams have access, allowing marketing to only see marketing and sales to only see sales for example. Or even an executive summary that only the board can see. You can partition HubSpot so it is aligned with your business's hierarchical structure.
Using HubSpot Reports
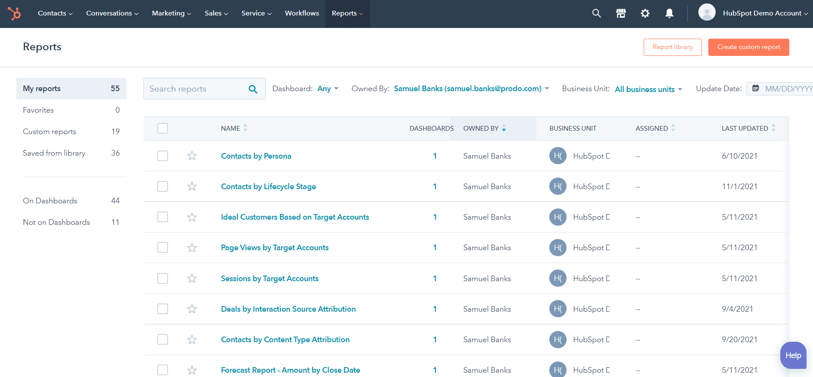
If you head over to ‘Reports’ within the ‘Reports’ tab - a touch confusing we know - you’ll find a central library of all the reports in your HubSpot portal that have been consolidated into one list. Once again, you can filter this list making it easy and convenient to take a look at all aspects of your data. You can filter by person, dashboard, or time range.
Along the left-hand side, you can see there are also preset filters so you can customise your view for just the reports that you have built yourself. It’s important to note that depending on your type of subscription to HubSpot, you may be limited in how many reports you can create.
Within this list view, you can also quickly add a report to a specific dashboard by ticking the box to the left of the chosen report and then at the top of the list, click ‘add to dashboard’, and choose where you would like this report to sit. You can also follow this route to delete a report or manage ownership and access.
Using HubSpot's Report Library
If you head over to the report library if you're unsure where to get started, this can be found by clicking on the top right corner button that says ‘Report Library’ whilst in the reports section. There will be up to 189 custom-built, out-of-the-box reports that HubSpot provides as soon as you take out your subscription. These are then sectioned into different frameworks based on how the reports work.
For example, there are reports for ads if you have an ads account, reports for productivity if you’re looking into sales rep performance or ticket reports for those interested in the customer service side. You can also look at web traffic reports which work largely off the specific tracking code that you'll install once you take out HubSpot.
And that's pretty much it, that's how reporting works from a high-level overview. The dashboards are a good way to consolidate and bring together your reports which you can then divide using numerous different filters or even create custom reports if there isn’t an out-of-the-box report that fits your bespoke needs.
If you're looking for further HubSpot support from a dedicated Hubspot agency, our team would ❤️ to help you out! Book a call with us today. Alternatively, if you have a Umbraco website, we are pleased to say that we are a specialist Umbraco agency that specialises in Umbraco websites also.